Several months ago, I wrote “Do Not Own It” as Ohio school leaders were beginning to absorb the effect of property-tax reform on district forecasts. The message was simple: when external rules change after a forecast is filed, do not carry the resulting variance as though it were a management miscalculation. That message still matters. But the question leaders now face is more practical: We were okay. What changed?
The updated leadership message: Start with what we knew then. Identify what changed. Show what it means now.
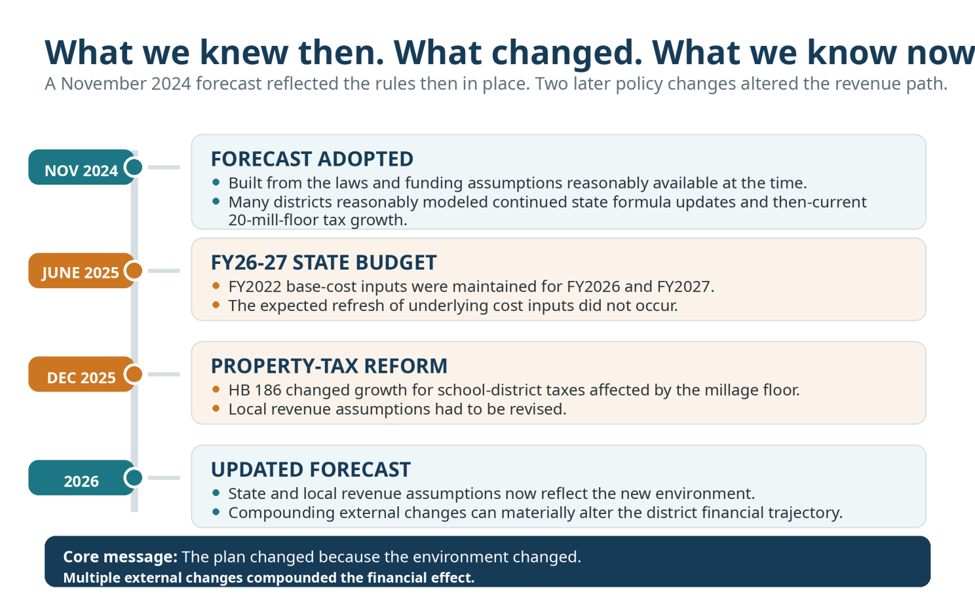
Figure 1.A "then versus now" timeline gives leaders a neutral place to begin: what was knowable when the forecast was built, and what changed afterward.
Start with what was knowable in November 2024
A five-year forecast is not a promise that the future will behave exactly as projected. It is a financial model built from the laws, funding parameters, economic conditions, contracts, staffing plans, and other information reasonably available at the time.
In November 2024, many Ohio districts reasonably anticipated that the next biennium would continue some updating of the cost side of the school-funding formula. Districts affected by the traditional 20-mill floor also had reason to model some inflationary growth in local property-tax collections as values increased. Those were assumptions made under the environment then known—not guarantees about future law.
Two external changes reset the revenue plan
First, the FY 2026–FY 2027 state budget completed the phase-in of the school-funding formula while maintaining FY 2022 base-cost inputs for FY 2026 and FY 2027. The underlying cost inputs were not refreshed for the new biennium. For districts that had reasonably forecast continued updating of those inputs, the state-revenue path moved below what had been projected.[1]
Second, House Bill 186 (property tax reform) was signed in December 2025. For districts affected by the millage floor, the law authorizes a property-tax reduction that limits or eliminates increases in those taxes according to inflation. For districts that had forecast inflationary property-tax growth under the prior law, the local property-tax path also moved below the prior plan.[2]
Either change alone matters. Together, they can reset both sides of the recurring revenue plan at the same time. That is the compounding change the forecast must now absorb—and the change leaders must now explain.
Why less state revenue is not automatically replaced locally
Ohio’s funding formula estimates how much of the per-pupil base cost should be supported locally. The formula calls this “local capacity.” For boards and communities, translate that term into revenue: when the formula calculates more local capacity, it assumes more local revenue is available and reduces the calculated state share.[3]
But formula math does not create local tax collections. Property-tax law determines what existing levies can generate, and additional recurring levy revenue requires voter approval. Property-tax reform can constrain, flatten, or reduce local property-tax growth even while the formula assumes more local revenue. The district can therefore receive less formula-based state revenue without an equal local increase to replace it.
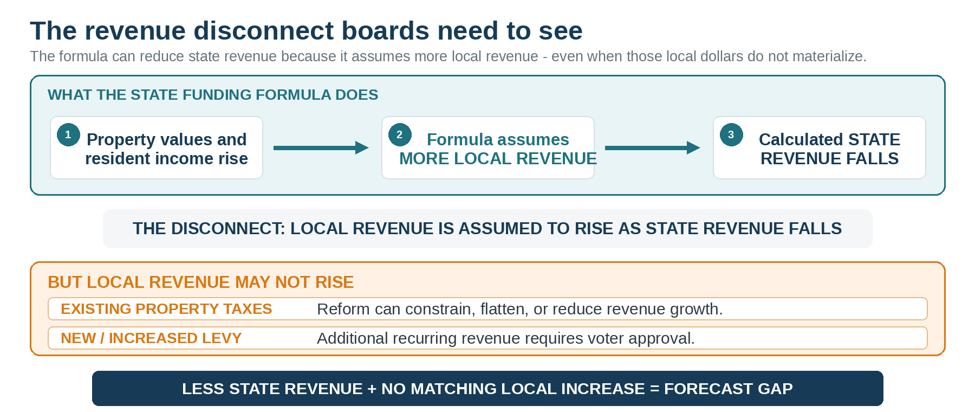
Figure 2. The formula assumes local revenue will rise as it reduces the calculated state share. Property-tax law and voter action determine whether that local revenue actually materializes.
The new normal: a lower recurring revenue path
This is where the external changes become a financial-planning problem. A November 2024 forecast may have carried modest growth in both state revenue and local property-tax revenue across several years. When the current forecast resets both trajectories lower, the impact is not confined to the year in which the change occurred.
Each year’s lower recurring revenue becomes the starting point for the next year. The gap compounds across the remaining forecast horizon and can move the structural deficit forward quickly. That can happen while cash remains healthy in the near term—and even while district leaders reduce or constrain spending.
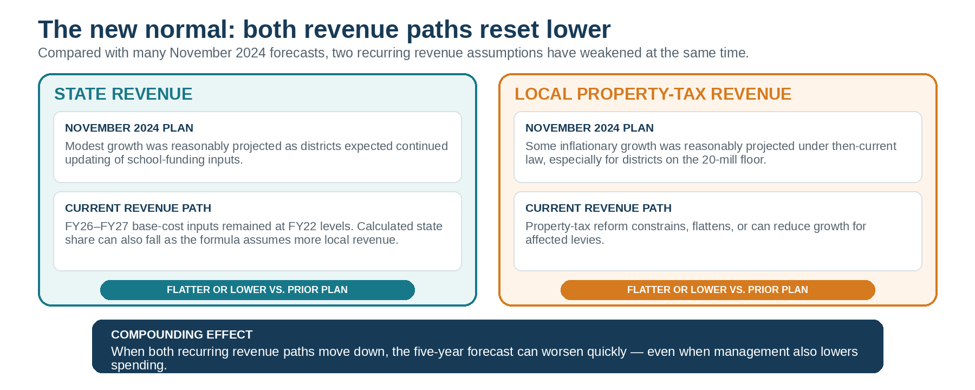
Figure 3. Compared with many November 2024 plans, both major recurring revenue paths can now be flatter or lower. When both reset downward, the effect compounds across the five-year forecast.
The important message is not that one forecast was “right” and the other was “wrong.” The November 2024 forecast reflected the laws and revenue environment then known; the current forecast reflects the environment now in place. The widening difference between them is what leaders need to teach.
THE MESSAGE IN ONE SENTENCE: We are not explaining one bad year. We are explaining two recurring revenue paths that now sit below the prior plan—and a gap that compounds across the forecast.
The worsening forecast is where the change becomes visible.
When a board member asks, “We were okay. Why aren’t we now?” start with the district’s own November 2024 forecast beside the current forecast. That side-by-side comparison establishes the change in financial condition before anyone tries to assign a cause. In the three supplied Ohio district examples below, FY 2029 total revenue in the updated forecasts is approximately $6.4 million, $6.1 million, and $7.6 million lower than the November 2024 projections.
The spending comparison answers the next natural question: Did the forecast worsen because the district spent more? In all three examples, FY 2029 expenditures and other financing uses are also lower than the November 2024 forecast. In two examples, the annual operating result still deteriorates materially. In the third, lower spending largely offsets the revenue decline.
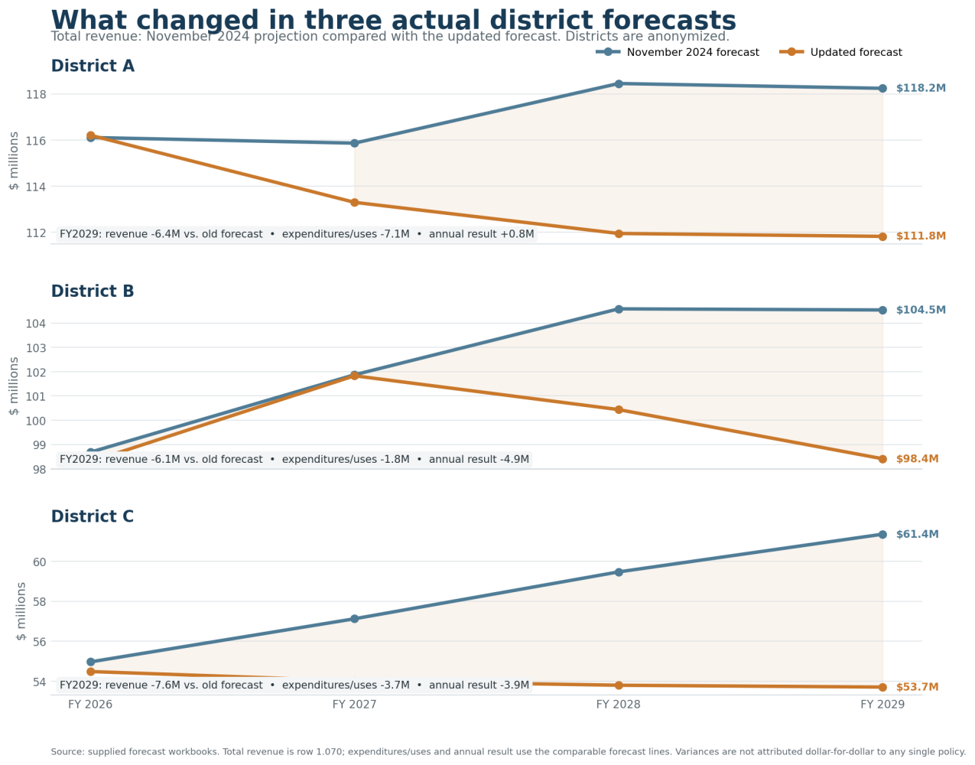
Figure 4. Three district forecast comparisons show the revenue path moving materially below the November 2024 plan. The chart shows changed financial condition—not a dollar-for-dollar legislative attribution.
THE MANAGEMENT MESSAGE: A worsening forecast is not, by itself, evidence that management spent more than planned. In all three examples, the spending plan also moved lower; the recurring revenue path moved down materially.
Only after the change in condition is clear should the analysis isolate cause. A total forecast variance is not automatically a legislative impact. Levy-specific property-tax modeling and school-funding analysis can quantify the pieces that can credibly be attributed to policy changes, while enrollment, staffing, compensation, services, and other updated assumptions are shown separately.
How treasurers and superintendents can tell the story
The strongest board and community message should follow the same order as the analysis: what we projected then, what changed externally, what happened to recurring revenue, what that did to the forecast, and what management is doing now.
- Start with “We were okay. What changed?” Put the November 2024 forecast beside the current forecast. Begin with the changed revenue path—not with a defense of the old forecast.
- Name the two external revenue changes. Explain what changed in projected state revenue and what changed in projected local property-tax revenue. Keep the first explanation simple and district-specific.
- Explain the replacement gap. If the formula assumes more local revenue and reduces the state share, explain that the local dollars do not automatically appear. Existing taxes are governed by law; new recurring levy revenue requires voter approval.
- Show the compounding forecast effect. A lower recurring revenue base carries forward. Show how the change affects the recurring operating result and moves the structural deficit forward across the five-year forecast.
- Show what management has already changed. If spending projections are lower than in November 2024, say so. Then explain what further adjustments are—or are not—reasonable and sustainable.
- Quantify carefully and reframe accountability. Separate measured policy effects from other updated assumptions. The earlier forecast used the information then available; the district has updated the plan, adjusted what it can control, and is engaging the board early enough to preserve options.
DON’T SAY
“The forecast is worse because of decisions outside our control.”
TEACH INSTEAD
“Our November 2024 forecast reasonably assumed modest growth in state and local recurring revenue. The current forecast now shows both revenue paths below that prior plan. We have updated the forecast, adjusted spending, and here is the recurring gap that remains.”
What leaders should own now:
- An accurate current forecast and a side-by-side explanation of how the recurring revenue plan changed from November 2024.
- A clear distinction between external changes to state and local revenue and the spending decisions the district controls.
- A credible quantification of the policy-specific impacts, the district’s response to controllable costs, and early board/community conversations while options still remain.
That is the evolution of “Do Not Own It.”
Do not own external revenue changes as though they were management decisions. But do own the responsibility to explain what was reasonably known, show what changed, quantify the new revenue path, adjust what the district can control, and lead through a financial environment that is materially different from the one used to build the November 2024 plan.
The closing message: Do not own the external change. Own the explanation, the response, and the decisions that follow.
Sources and data notes
[1] Ohio Legislative Service Commission, H.B. 96 Education Greenbook, as enacted. The FY 2026–FY 2027 budget completed the phase-in while maintaining FY 2022 base-cost inputs. Source
[2] Governor of Ohio, December 19, 2025 signing notice for H.B. 186. The bill authorizes reductions for school-district property taxes affected by a millage floor to limit increases according to inflation. Source
[3] Ohio Revised Code §3317.017. The local-capacity calculation uses valuation and income measures and is used to determine the state share. Source
Forecast comparison note: The three forecast comparisons were derived from three individual district’s forecast workbooks supplied for analysis. District names are omitted from the article graphics. The comparison shows changed financial conditions; it does not attribute every variance to legislation. The article’s “flat or declining” framing refers to revenue performance relative to the earlier forecast path and may vary by district and revenue source.