Ohio is currently grappling with a property tax crisis that threatens local governance and public school stability. Despite the political rhetoric claiming that taxes are increasing due to local spending, the real cause is a systemic, top-down issue. Put simply, it is the direct consequence of intentional policies that have shifted the state share of essential services to individual homeowners.
The scale of this "Historical Burden Shift" over the last half-century is significant. In 1975, the property tax burden was more equitably distributed, with businesses contributing 53.9% of the total and residential or agricultural owners contributing 46.1%. By 2023, that relationship had not only inverted but widened to a breaking point: the business share has plummeted to 32.5%, while the residential and agricultural share has surged to 67.5%.
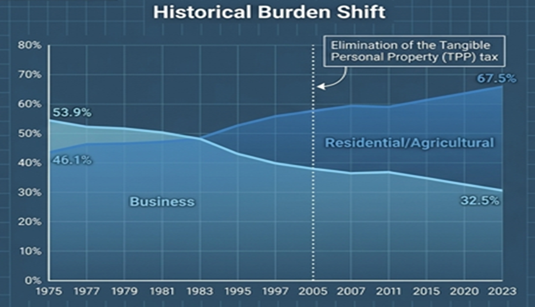
This 21.4% shift in the tax burden has fundamentally broken the social contract with Ohio homeowners. Residents are now forced to shoulder a disproportionate share of the cost for public education and local government, because state-level "tax cuts" have created a revenue vacuum that local property taxes are forced to fill. To understand this crisis, one must look back at the original legislative intent of Ohio’s modern tax structure.
The Erosion of the 1971 Personal Income Tax
The foundation of Ohio’s modern fiscal balance was laid with the passage of H.B. 475 in 1971. This landmark legislation established the state personal income tax with a clear strategic intent: to provide a stable, statewide revenue stream that would fund social welfare, increase aid to K-12 education, and provide direct property tax relief to homeowners.
The Original Intent vs. Current Reality
|
Category
|
Original Mandate (1971 / H.B. 475)
|
Current Deviation
|
|
Primary Objectives
|
Funding welfare caseloads, increasing aid to K-12 schools, and delivering property tax relief.
|
State share of K-12 funding has plummeted; revenue is diverted to private vouchers and corporate tax welfare.
|
|
Relief Mechanisms
|
Immediate 10% rollback; homestead credits for qualifying taxpayers; 2.5% owner-occupied tax credit (1978).
|
Homestead exemptions have been tightened (2013) and the state has failed to index property tax relief to historic rising property values.
|
|
Tax Structure
|
Progressive: Rates increased as a taxpayer's income rose, ensuring contributions matched the ability to pay.
|
Flat: A transition to a 2.75% flat rate (H.B. 96) for all income above $26,050, regardless of total earnings.
|
The transition toward a "flat tax" via H.B. 96 represents a total abandonment of equity. Under the current model, an Ohio millionaire pays the exact same 2.75% income tax rate as a schoolteacher or a childcare worker. Critically, for Ohioans earning between $26,050 and $100,000, the rate was already 2.75% for several years. The recent move to a flat tax was not a targeted windfall for the state's most affluent residents, as their top rates were pulled down to match the middle while the resulting funding gaps were pushed onto local property owners.
Legislative Disinvestment (2005–2026)
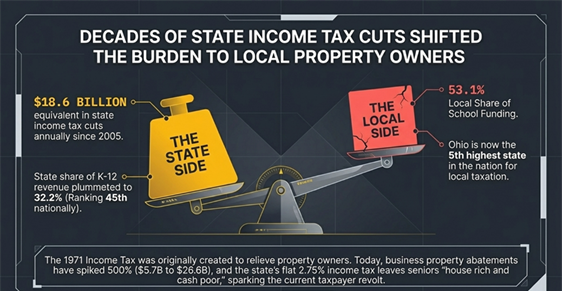
This erosion of the 1971 promise was an intentional, multi-decade campaign of disinvestment in public schools and local government. Since 2005, a series of state-level tax reductions have created a staggering $18.6 billion annual revenue gap, forcing local school districts to choose between fiscal insolvency and asking homeowners to pass levies.
- H.B. 66 (2005): This legislation initiated the modern crisis by reducing state income tax brackets by 21% and eliminating the Tangible Personal Property (TPP) tax…a move that wiped out nearly 20% of all public school local tax collections.
- The Mid-2010s (2013 & 2015): A 10% income tax cut in 2013 was paired with language that made it significantly harder for seniors to qualify for homestead exemptions. In 2015, another 6.3% reduction pushed income tax rates lower than they were in 1972.
- The Flat Tax Transition (2019–2026):
- H.B. 166 (2019): Enacted a 4% across-the-board rate reduction.
- H.B. 110 (2021): Adjusted brackets to favor the wealthy; the 16.8% reduction for those earning over $221,300 was three times greater than the relief provided to those in lower brackets.
- H.B. 33 & H.B. 96 (2023–2026): These bills collapsed the remaining brackets and lowered the top rate to 3.125% in 2025, eventually reaching a flat 2.75% in 2026. This final phase alone reduces state revenue by an estimated $2.3 billion.
The crisis is being exacerbated even now by new legislative measures that will further shrink the local business property tax base.
In 2025, the passage of H.B. 15 delivered yet another blow to local tax revenues by lowering the assessment rates on public utility personal property. Assessment for transmission lines, distribution lines, and pipelines will drop from 88% to 25%, while new electric generation will drop from 25% to 7%. Simultaneously, the state has siphoned $1.06 billion away from public schools to fund private school vouchers and other non-public education.
While business property tax abatements have spiked 500%, exploding from $5.7 billion to $26.6 billion There is an undeniable correlation between these state-level giveaways and the necessity for local districts to seek tax increases. The myth that "school districts did this" is a fiscal fallacy; school districts were left with no choice but to seek local property tax increases. In addition, it is important to note that personal income tax cuts have done very little, if anything, to help fixed-income and disabled taxpayers stay in their homes.
Ohio’s National Standing
Ohio’s national standing is a clear indicator of systemic failure in state stewardship. The rhetoric of "pro-growth tax cuts" masks the reality that Ohio has become a national outlier in how it penalizes local property owners.
- State Share of K-12 Revenue: The state's share of K-12 funding has plummeted to 32.2%, ranking Ohio 45th in the nation for state support of education.
- Local Tax Burden: To compensate for the state’s lack of investment, the local share of school funding has climbed to 53.1%. Consequently, Ohio now ranks 5th highest in the nation for local taxation.
- The School Funding Formula Myth: The legislature has "cast off" several different funding formulas, claiming they failed. In reality, these formulas did not fail due to design; they failed because they were NOT FUNDED. This cycle of planned obsolescence allows the state to avoid its financial obligations.
Being 45th in state support is the mathematical cause of being 5th in local burden. This is "The $18.6 Billion Shell Game." State-level tax cuts are not savings; they are merely tax shifts that appear as property tax increases on the local ballot.
In Conclusion
The evidence is clear: Our property tax crisis is in part the result of personal income and business tax giveaways by our Ohio Lawmakers.
For decades, state lawmakers have traded the long-term stability of our communities for short-term political favor, passing income and business tax cuts that have limited the state’s ability to meet its constitutional obligations.
Your role as CFO is to help clarify how we arrived at this point regarding property taxation. Public school districts should not be attacked for decades of giveaways in personal income and business taxation by our state legislature.
Continuing this path does more than just increase tax bills; it mortgages our children’s future for the sake of political expediency. We cannot expect our communities to thrive while homeowners are squeezed to subsidize corporate interests and private education.