The August forecast filings at the Ohio Department of Education and Workforce (ODEW) show a significant increase in the number of districts projecting financial strain.
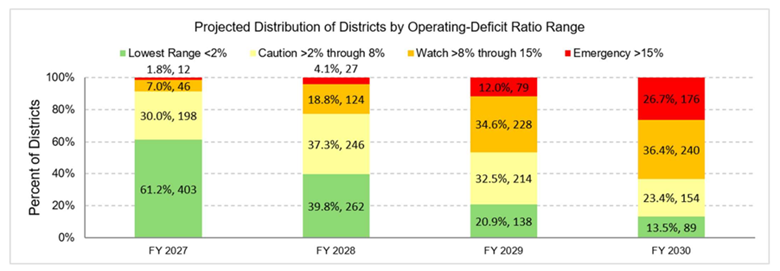
- 39% of districts project an operating-deficit ratio above 2% in FY 2027.
- The percentage grows to 86% by FY 2030.
- District costs continue to rise at roughly inflationary rates.
- Operating revenue is nearly flat and does not keep pace.
- The recurring gap compounds into larger operating deficits.
The statewide outlook changes quickly
In FY 2027, approximately 39% of the 659 districts are projected to experience significant, severe, or critical financial strain based on their operating-deficit ratios. By FY 2030, that share increases to approximately 86%. More importantly, the number in the severe or critical ranges increases from 58 districts, or 8.8%, to 416 districts, or 63.1%.
School districts provide services to students and are personnel-intensive organizations. If the gap continues, closing the imbalance eventually requires reductions in staff, programs, and student services; requests for additional recurring local revenue; or both.
Key takeaway: The concern is not simply that more districts project operating deficits. The size of those deficits increasingly reaches levels at which restoring balance could materially reduce programs and services available to students or require additional support from local taxpayers.
These are ratio-only indicators of projected financial strain, not official state fiscal-status declarations. Cash balances may affect the timing of corrective action, but they do not eliminate a recurring imbalance between revenue and expenditures.
The Recurring Growth Gap Drives Financial Strain
The projected shift toward more severe operating-deficit ratios is driven by an underlying statewide relationship: recurring operating expenditures are growing much faster than recurring operating revenue.
The statewide growth relationship
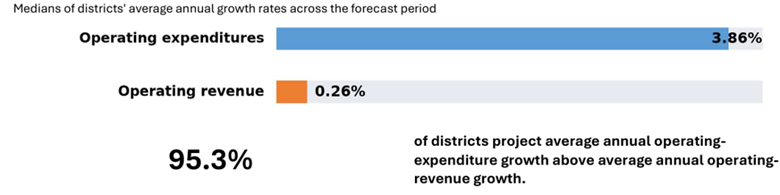
For the median district, annual expenditure growth exceeds annual revenue growth by 3.58 percentage points. Repeated over the forecast, that gap compounds into larger operating deficits and can rapidly erode available cash balances.
How the gap becomes financial strain
1. Costs continue to rise. School districts are personnel-intensive, and operating costs continue to rise.
2. Revenue does not keep pace. Median operating-revenue growth is nearly flat across the forecast.
3. The recurring gap compounds. Deficits recur, while cash reserves absorb the difference only temporarily.
Where the financial strain reaches students
When a recurring gap must be corrected, the choices become real. Districts may need to reduce staffing, academic offerings, student support, transportation, extracurricular opportunities, or other services; ask local taxpayers for additional recurring revenue; or use a combination of both. Cash balances may provide time for an orderly response, but they do not eliminate the recurring imbalance.
Questions stakeholders should ask
1. Which services provided to students are driving projected operating-expenditure growth?
2. How long can the available cash balance absorb recurring operating deficits while maintaining board policy?
3. Which recurring revenue sources are expected to remain flat or decline - state, local, or other - and what would replacing them require from local taxpayers?
4. If the projections hold, what will be the cost to students in lost programs and services?
Important context: These are ratio-only indicators of projected financial strain, not official state fiscal-status declarations. Official determinations also consider cash balances and other legal requirements. The median growth gap is calculated directly for each district; it is not the difference between two separately calculated classification medians.
Source: FY27 August School District Forecasts on file with ODEW